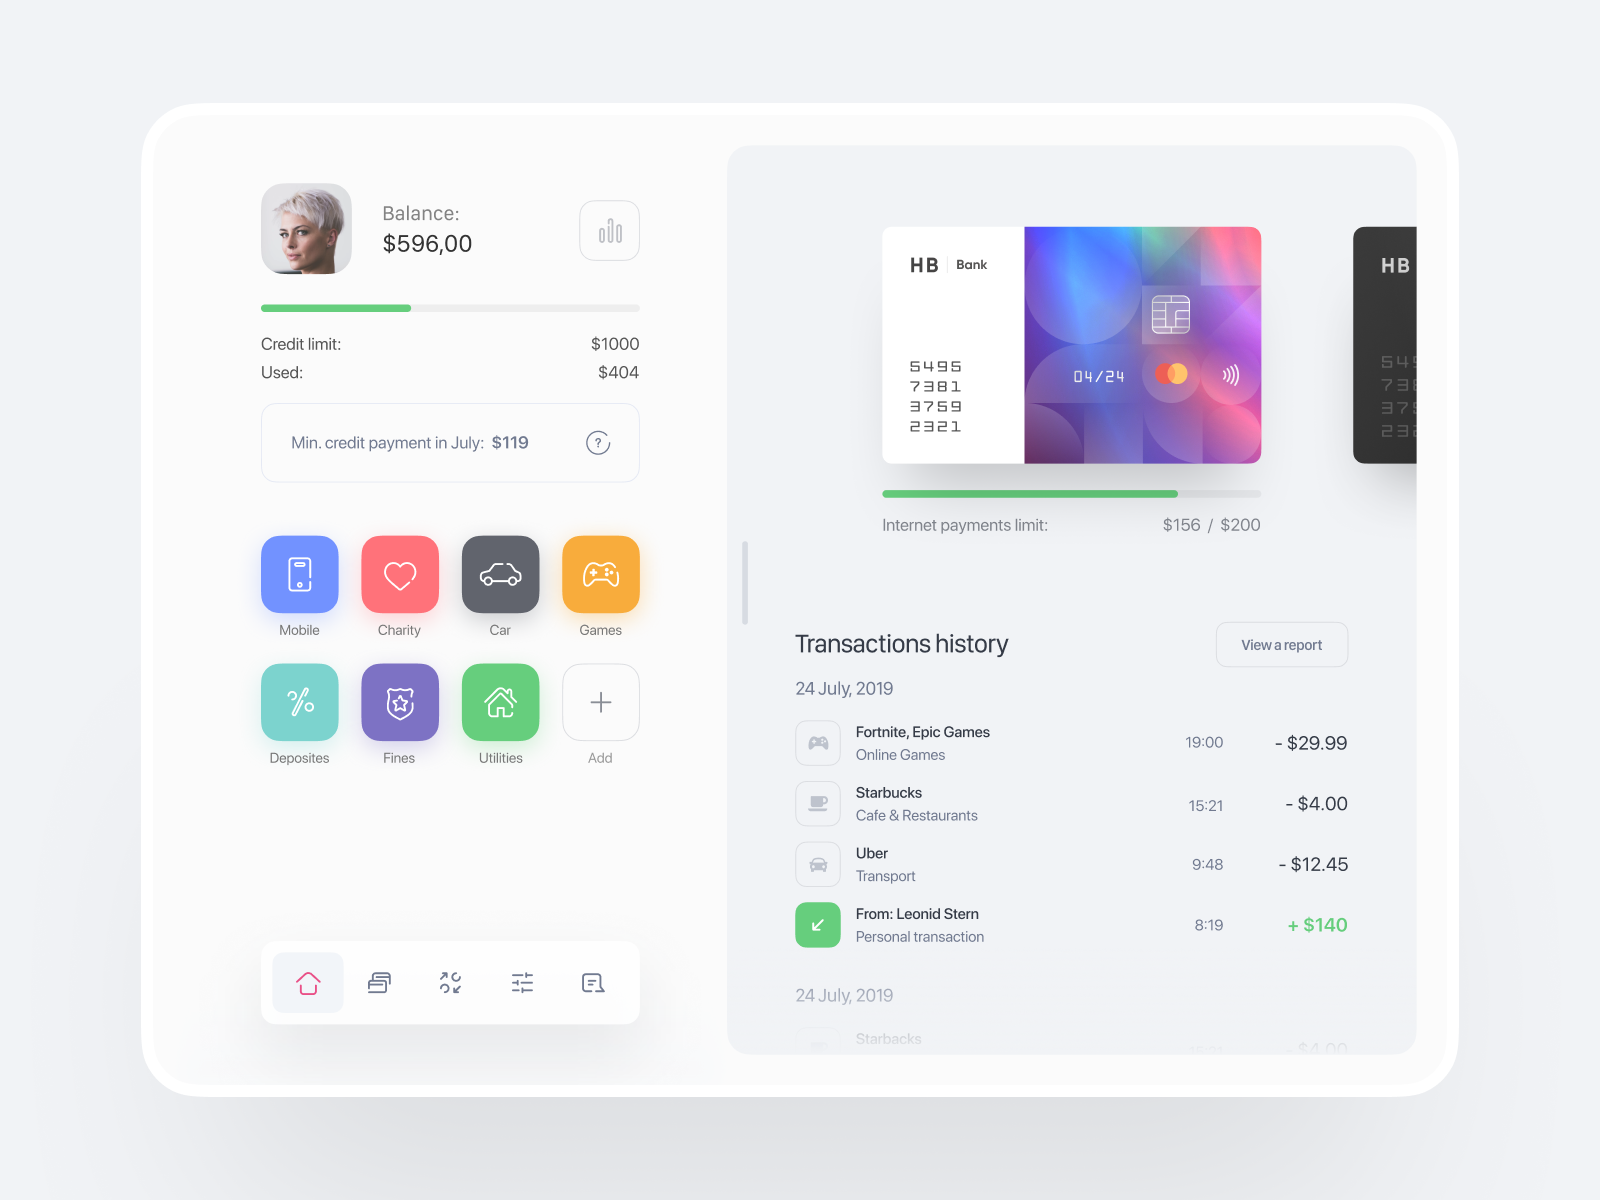
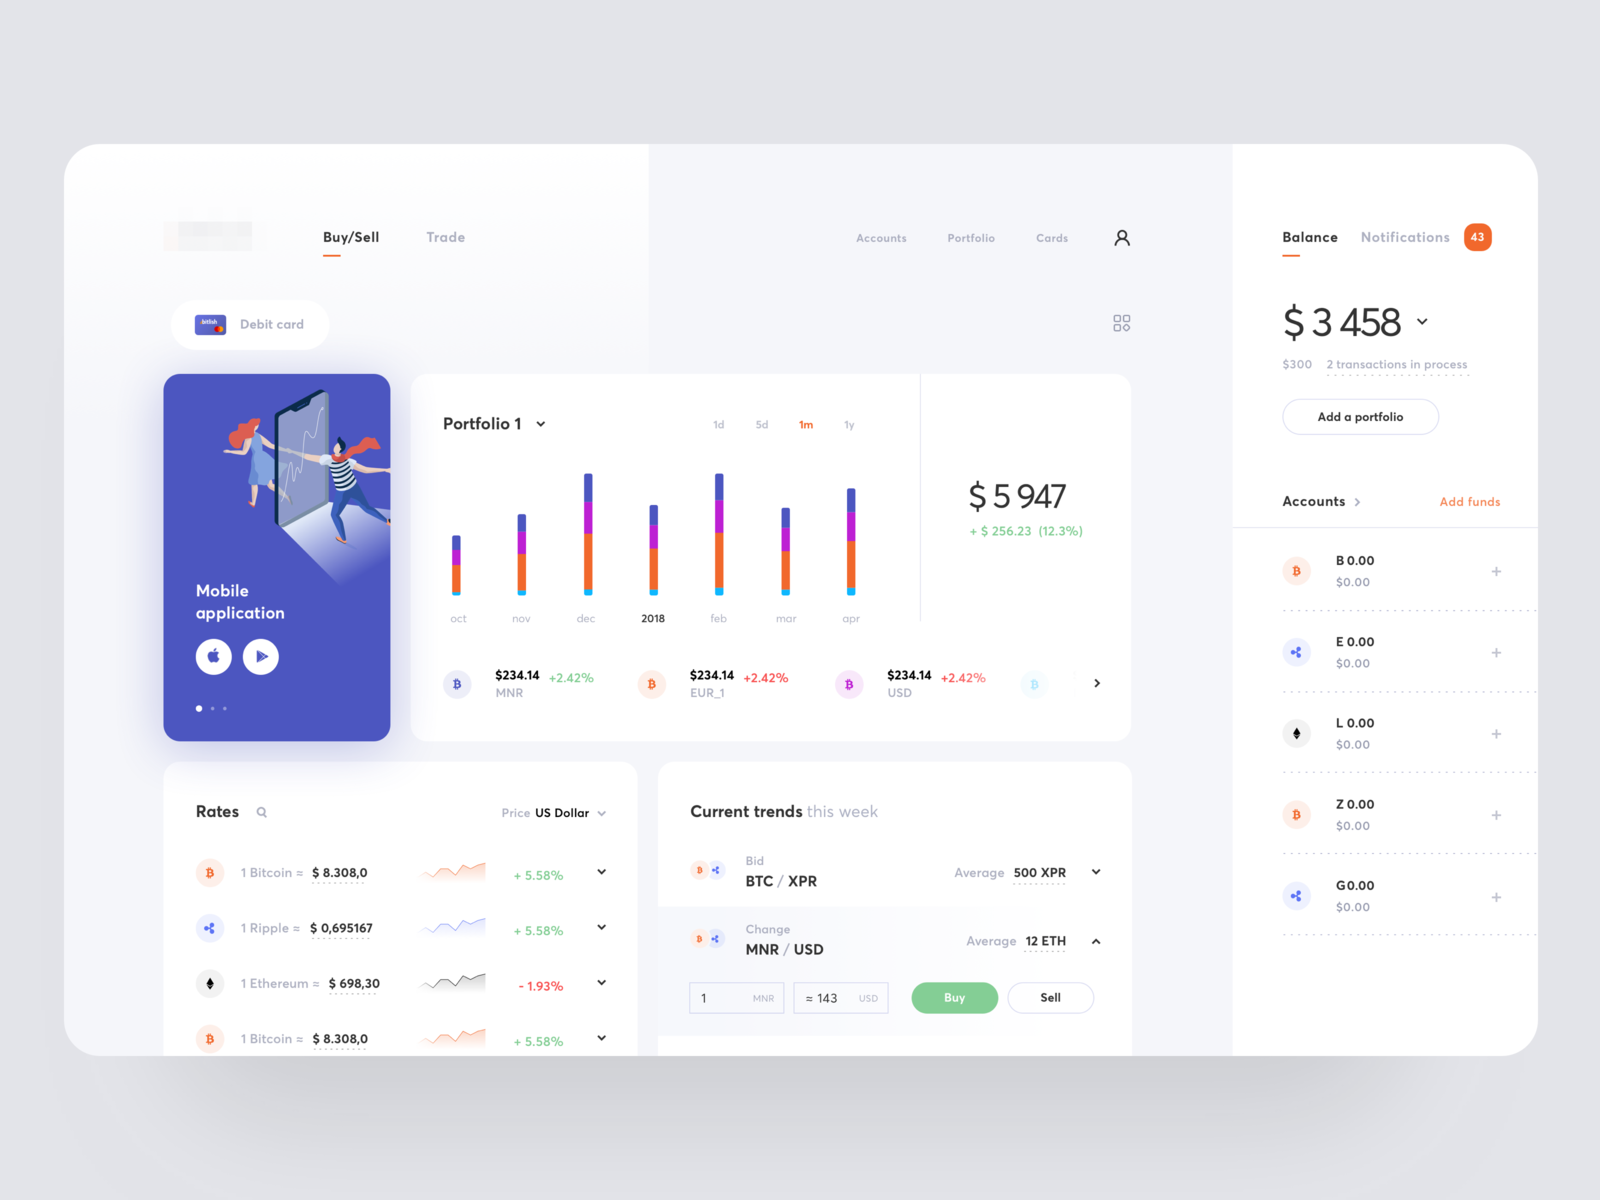
In business computer information systems, a dashboard is a type of graphical user interface which often provides at-a-glance views of key performance indicators (KPIs) relevant to a particular objective or business process.

In other usage, “dashboard” is another name for “progress report” or “report” and considered a form of data visualization. In providing this overview, business owners can save time and improve their decision making by utilizing dashboards.